Static simulations
To run a snapshot analysis at a particular point in time, select date and time of day. Net chhose violation limits for voltage and loading. The simulation should run automatically and the plots should update.Users are able to get overview information such as number of load, PV systems and storage on the netork, minimum and maximum voltages seen on the network, net flow at feeder head and system wide losses. The dashboard provides two meaningful plot the voltage_distance plot and the voltage_loading plot.
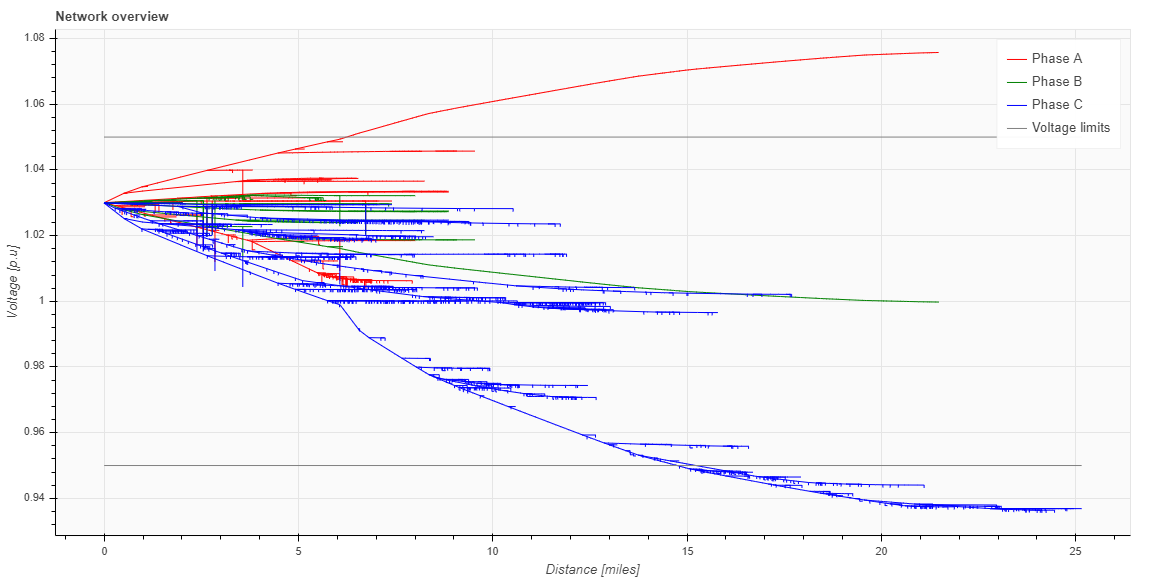
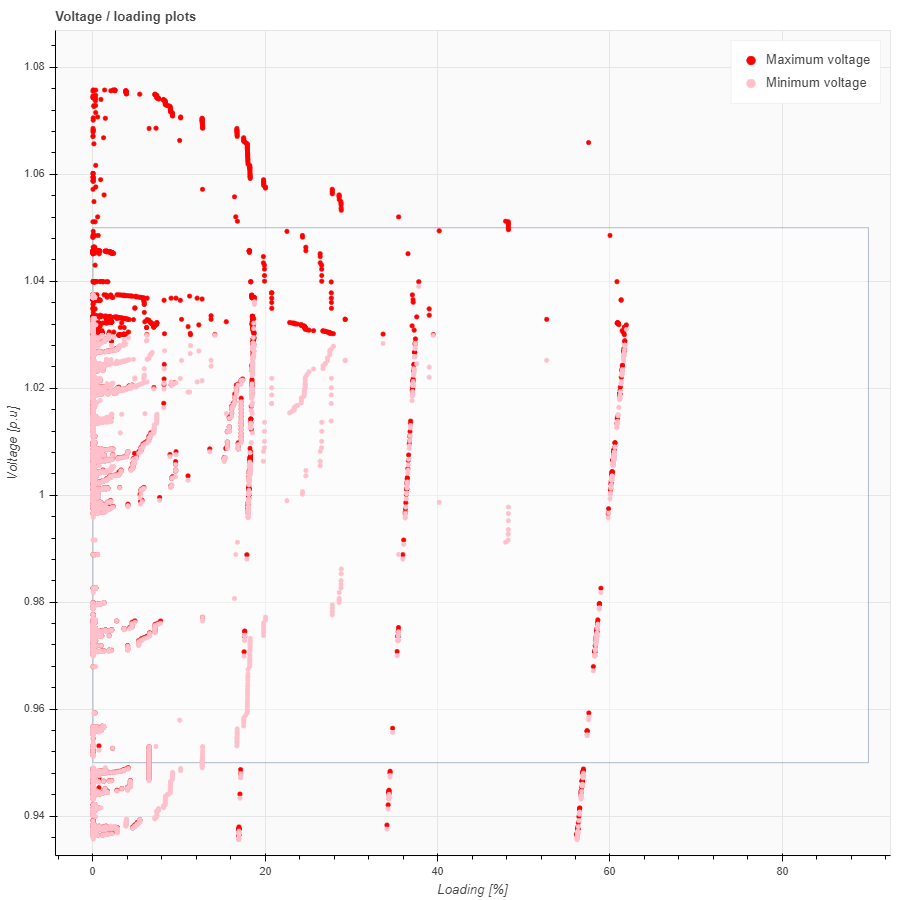
The two plots give planners clear understanding of system wide impaact of a newly added element on the distribution system. In addition to the plots, the two provides two tables that list current anf voltage constraint elements. PLanners can play around with advanced control settings or element capacity to ensure all values are within normal operating regions.
Time series simulations
To understand the impact of a new installation for a period of time, user may use time series simulations. The choose a starting and an end date. Next choose a PV or storage system and run the simulation.